

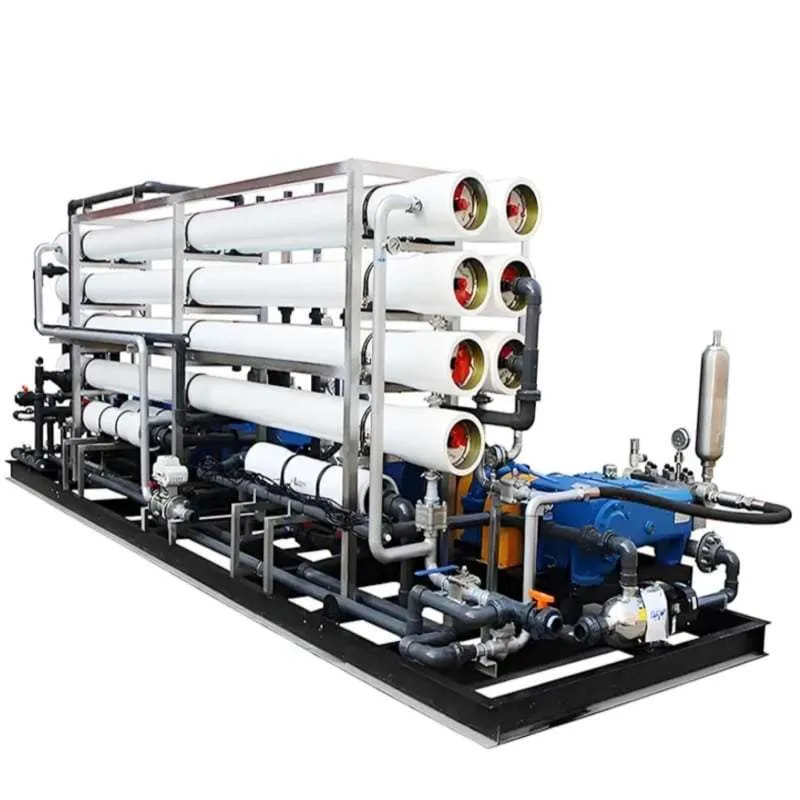
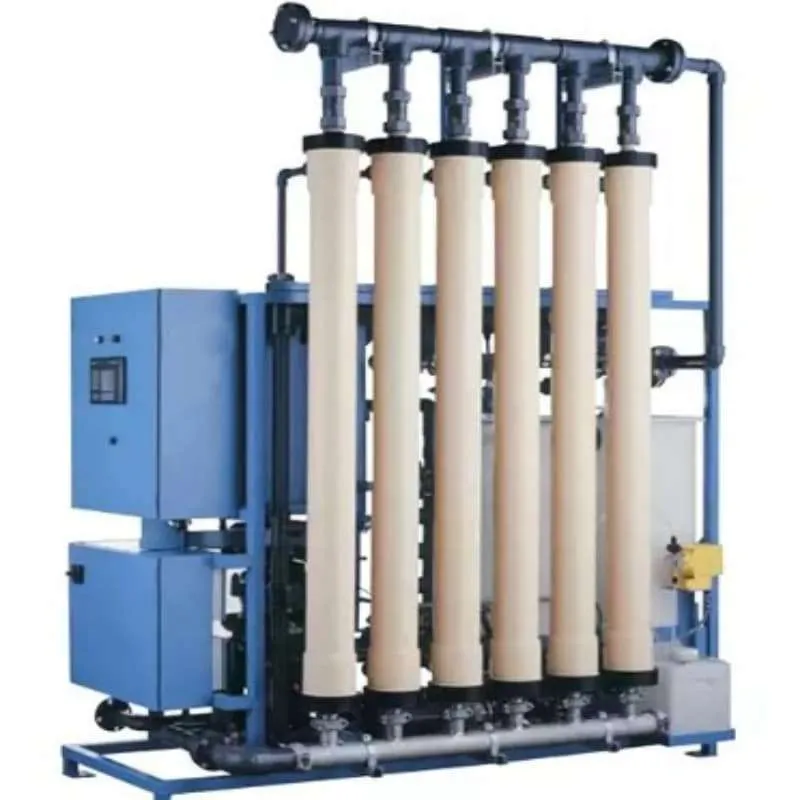
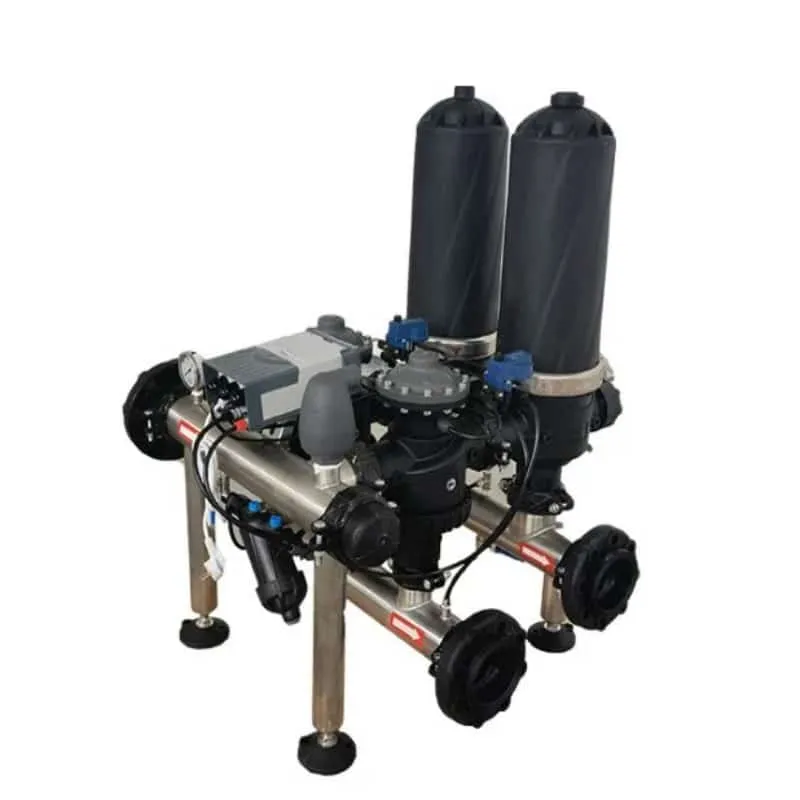
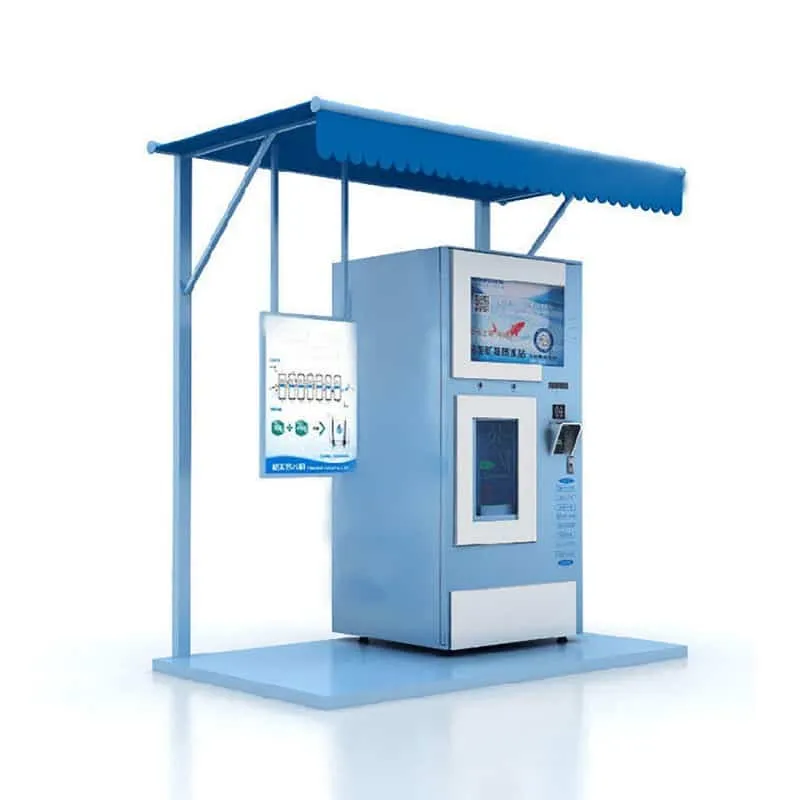
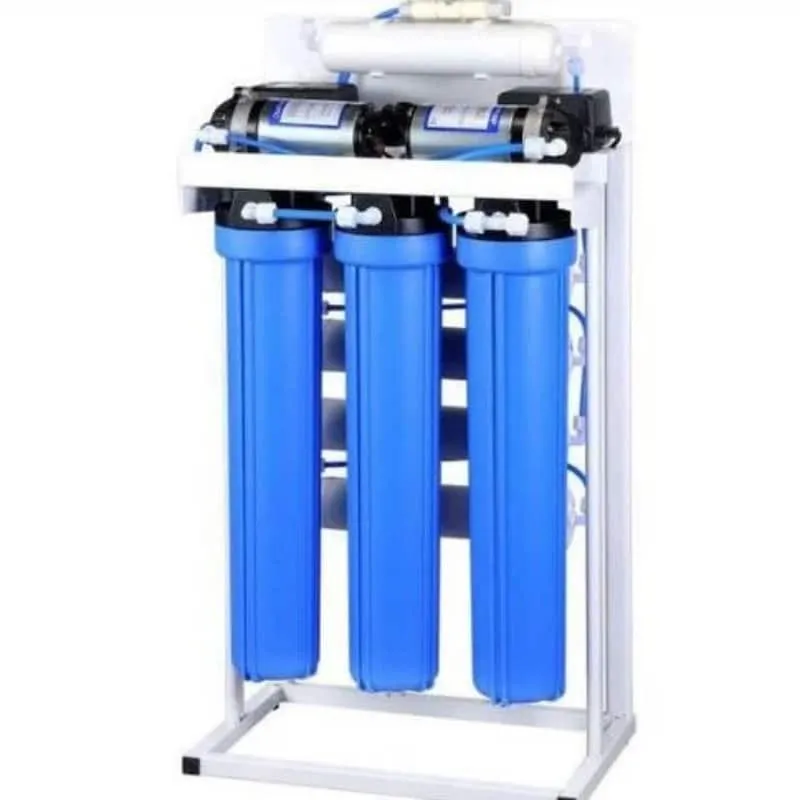
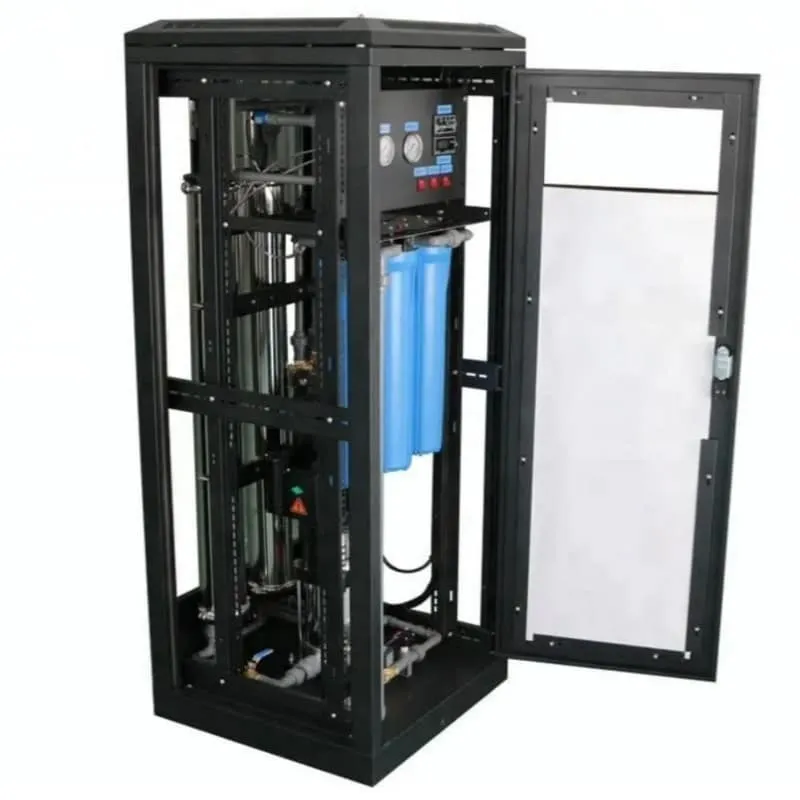
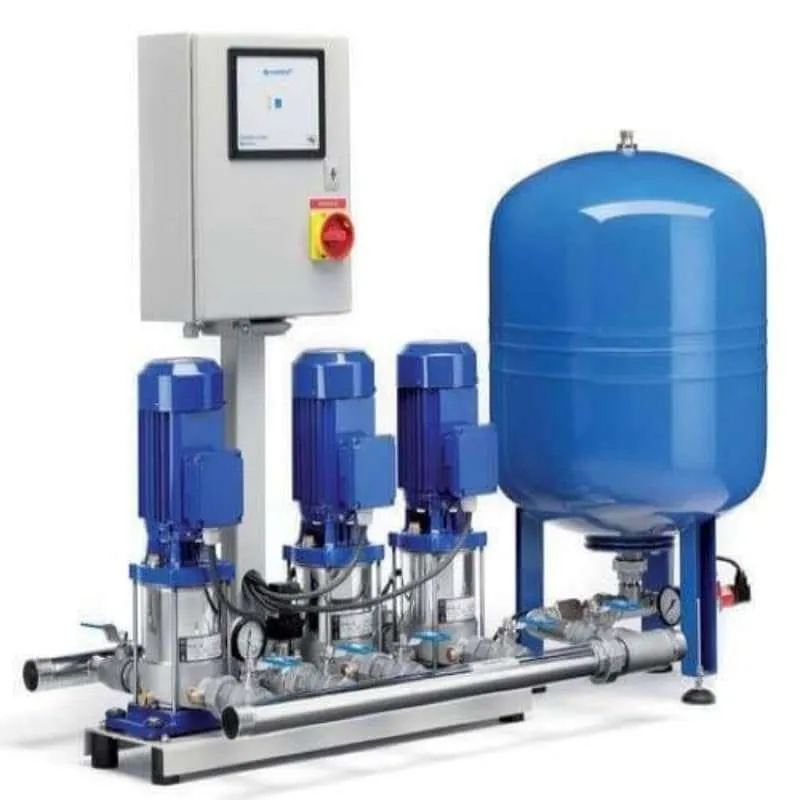

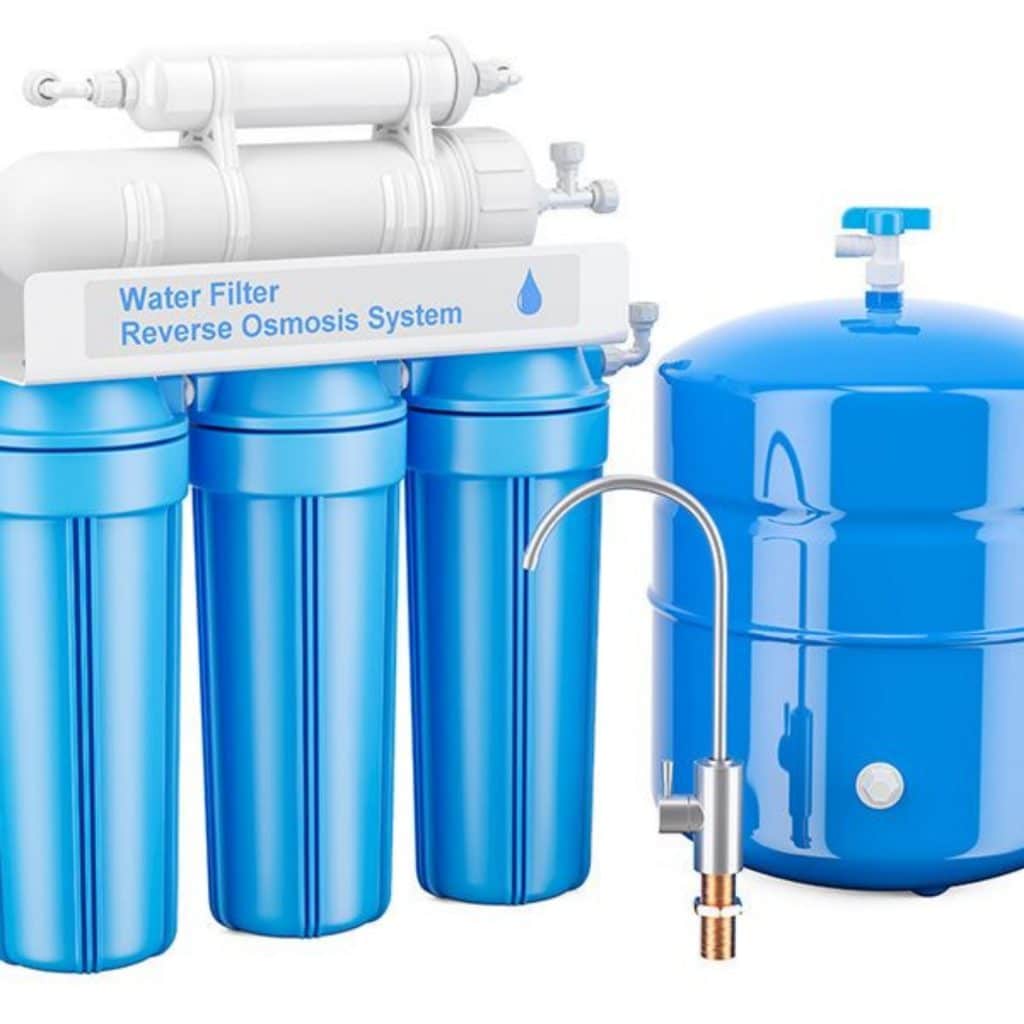



Feed pressure is the most important part of any high-capacity reverse osmosis machine. This variable directly controls permeate flux and salt rejection, which decides how well your system works. People who run industrial reverse osmosis systems usually set feed pressure from 150 to 300 PSI.
Higher pressure increases water production but also raises energy consumption per unit of permeate. When recovery rates go up, operating pressure rises, pushing specific energy consumption upward. Feed water with higher total dissolved solids also needs greater pressure. This pressure speeds up membrane fouling and compaction over time.
This article looks at key parameters, water chemistry, monitoring, and best practices. Knowing these things helps you get the best efficiency, purification, and filtration. Your capacity depends on mastering this balance. This water purification method works best when you pay attention to every variable that affects performance.
Key Takeaways
For best results, keep the feed pressure between 150 and 300 PSI.
To protect the membranes, balance the recovery rate with the risk of scaling.
Keep track of temperature changes, and adjust pressure so output stays the same.
Keep pH in check and remove chlorine to make the membrane last longer.
Use live sensors and automatic controls to work more efficiently.
Core Parameters for Reverse Osmosis Systems
Feed Pressure and Flux Performance
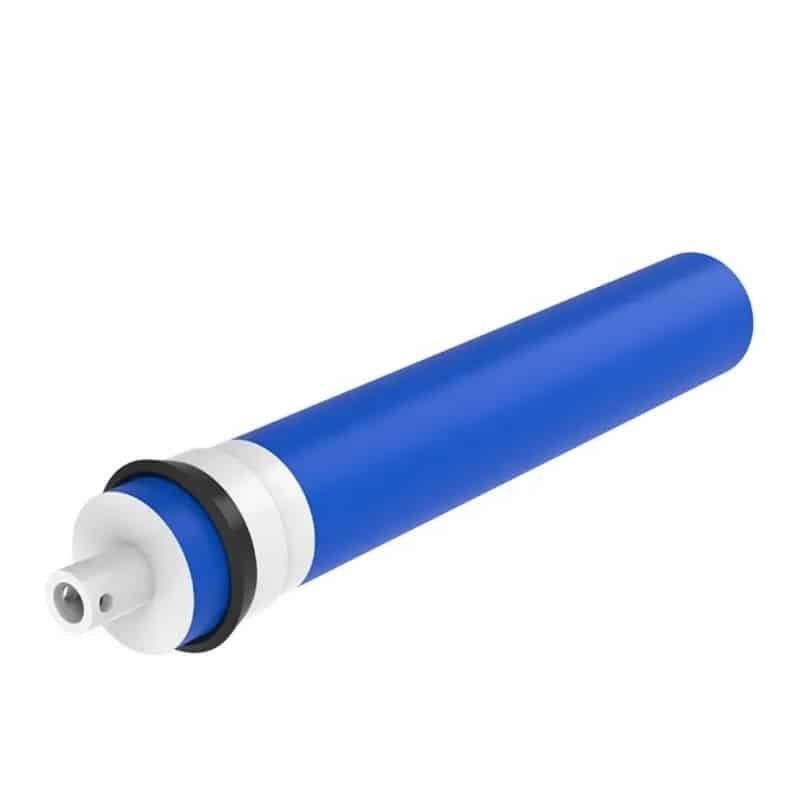
You need to know how feed pressure runs your reverse osmosis machine. For an industrial reverse osmosis system, the best working range is 150 to 300 PSI. More pressure in this range raises permeate flux. You get more clean water from each part of the membrane. This directly boosts how much water your system can make.
But more pressure has downsides. Your pumps use more energy as they work harder. The bigger worry is membrane damage. Too much pressure puts physical strain on the membrane materials. It speeds up compaction of the active layer. Compaction permanently lowers both flux and salt rejection rate. Once this happens, you cannot fix it. Your membrane loses performance and you must replace it sooner.
Pressure changes also cause issues. They create repeated physical stress on the membrane structure. You need steady pressure control to protect your equipment. The lowest inlet pressure for most reverse osmosis systems is 20 to 30 PSI. Your working pressure should stay within the 150 to 300 PSI range for the best results.
The table below shows the key parameters you should watch:
Parameter | Critical Range / Value | Notes |
|---|---|---|
Feed Pressure | Minimum inlet: 20-30 PSI; Operating: 150-300 PSI | High-pressure pumps keep things steady; pressure monitoring stops membrane damage |
Operating Temperature | Optimal: 65-85°F; Maximum: 113°F | Temperature affects membrane performance; automatic shutdown protection for extremes |
Recovery Rate | 50-90% (typical 75%) | Higher recovery cuts water waste but raises scaling risk; lower rates improve permeate quality |
Membrane Salt Rejection | Minimum 96% | Shows membrane efficiency; ensures steady water quality output |
Power Consumption | 220V/60Hz for commercial systems | Variable frequency drives and energy recovery devices improve energy use |
Recovery Rate and Temperature Impact
Your recovery rate decides how much feed water turns into usable permeate. For brackish water, typical recovery rates range from 50% to 90%. A common goal is 75%. Higher recovery cuts water waste. This boosts overall efficiency. But it also builds up minerals on the membrane surface. If you push recovery too high, you risk fast scaling. Scale deposits block membrane pores and weaken filtration.
Finding the best recovery rate means balancing production against scaling risk. Your feed water analysis shows you what rate is safe. Higher recovery needs more aggressive pretreatment and antiscalant dosing.
Temperature also affects your system a lot. Cold water has higher viscosity. It is thicker and harder to push through the membrane. To keep the same permeate flow when temperature drops, you must raise feed pressure. Warm water flows easier and increases your output.
The rule of thumb for this effect is well known. Permeate flow changes by 1.5% per degree Fahrenheit change in feed water temperature. In Celsius terms, this is about 2.7% per degree Celsius. Some sources report a range of 1.5% to 2% per degree Fahrenheit. This equals 2.7% to 3.6% per degree Celsius. A 10-degree Fahrenheit drop lowers your permeate flow by about 15%. You must plan for seasonal temperature changes when you design your system.
Your capacity depends on mastering these interactions. Feed pressure, recovery rate, and temperature are not separate. Changing one forces you to adjust the others. Energy efficiency matters because cold weather raises your pressure needs and operating costs. A well-designed industrial reverse osmosis system includes temperature compensation to keep steady output all year. Watching these parameters helps you get the best purification and filtration performance.
Feed Water Quality for Industrial Reverse Osmosis System

Managing feed water quality is essential for all reverse osmosis systems. For an industrial reverse osmosis system, this task is critical. Your feed quality determines how long your membranes last and how well your system performs. Control pH, chlorine, and particulate content. These pretreatment parameters keep your system efficient.
Optimal pH Range and Control
Thin-film composite membranes are stable over a broad pH range. The optimal pH for membrane lifespan is 6 to 8. Running within this range keeps the membrane surface stable and prevents scaling.
pH affects salt rejection performance. At high ionic strength, reduced repulsion between sodium ions and the membrane surface decreases salt rejection. Target the 6 to 8 zone for best performance.
Chlorine poses a serious threat to your membranes. Residual chlorine causes oxidation that lowers the salt rejection rate. Even 1 PPM of chlorine triggers degradation within 200 to 1000 operating hours. Higher concentrations speed up the damage. Alkaline conditions accelerate degradation. Remove chlorine before it reaches your membranes.
Pretreatment and Scaling Prevention
The importance of pretreatment systems is clear. Effective pretreatment protects your investment. The SDI tells you how much particulate matter your feed water contains. Keep the 15-minute SDI value below 4.0 to minimize fouling. SDI values above 5 indicate unacceptable plugging.
The SDI to cleaning frequency relationship is clear:
SDI below 1: several years without colloidal fouling
SDI below 3: several months between cleaning
SDI 3 to 5: particulate fouling likely, requiring frequent cleaning
SDI above 5: unacceptable, requiring additional pretreatment
Preventing and addressing fouling and scaling starts with feed analysis. Your feed water must be free of hardness, iron, and other foulants. These cause scaling on the membrane surface, especially at higher recovery rates.
Antiscalants prevent scaling by keeping minerals in solution. You can extend your system’s capacity and reduce cleaning frequency with proper dosing.
The typical antiscalant dosing range is between 0.5 and 4 mg/L.
Base your dosing parameters on a thorough analysis of your feed. The right amount depends on your water chemistry and recovery rate. This approach helps you maintain filtration quality and steady filtration performance. Good purification starts with knowing your feed water.
Monitoring and Control for Optimal Performance
You need a clear picture of your system’s health to achieve optimal performance. Five critical performance metrics tell you everything: SDI, differential pressure, normalized permeate flow, percent rejection, and pressure drop across the membrane. Each one reveals a different aspect of your system’s condition. SDI shows particulate load in your feed water. Differential pressure indicates fouling buildup. Normalized permeate flow tracks production against baseline expectations. Percent rejection measures membrane salt removal. Pressure drop across the membrane, calculated as feed pressure minus concentrate pressure, signals growing resistance inside the elements. Every membrane manufacturer sets a maximum allowable pressure drop limit. Exceeding that limit risks physical damage to your membranes.
Real-Time Sensors and Data Logging
Real-time sensors transform how you track these parameters. Pressure sensors, flow meters, and conductivity probes give you instant feedback. You can spot anomalies the moment they appear instead of discovering them during routine checks. Conductivity monitoring deserves special attention because it serves multiple purposes. It assesses water purity, detects membrane deterioration, and guides operational adjustments.
Water quality assessment: Elevated conductivity levels reveal dissolved ions or impurities in your permeate.
Membrane issue detection: Rising conductivity over time signals potential membrane problems, enabling proactive maintenance.
Efficiency optimization: Continuous conductivity data helps you fine-tune pressure, feed flow rates, and chemical dosing.
Pressure monitoring across pretreatment components and security filters acts as an early warning system. When differential pressure rises, fouling or scaling accumulates on filter surfaces. You can intervene before particulate breakthrough reaches your RO membranes. The 5-micron security filters serve as the final barrier, and their pressure drop tells you when replacement is needed.
Automated Adjustment Systems
Automated control systems take monitoring one step further. They adjust feed pressure or recovery rate based on real-time data without manual intervention. This reduces human error and prevents damage before it occurs. The table below shows key thresholds you should program into your control system:
Monitoring Parameter | Threshold / Condition | Consequence if Ignored |
|---|---|---|
Normalized pressure drop (ΔP) | Scheduled CIP when ΔP exceeds manufacturer’s maximum allowable limit | Membrane damage and energy loss |
Filter element pressure difference | Maintain when pressure difference indicates fouling | Potential for fouling and bypass |
Media filter pressure loss | Monitor and maintain within limits | Indicates fouling potential |
Rear-stage pressure rise | High recovery rate | Pressure rises faster than front-stage, leading to scaling |
These monitoring and adjusting operating parameters represent advanced optimization techniques. They protect your capacity and extend membrane lifespan. Data-driven decisions beat guesswork every time. Your filtration system performs best when you respond to what the sensors tell you. Water quality stays consistent, recovery stays within safe limits, and your equipment lasts longer. The investment in sensors and automation pays for itself through reduced downtime and fewer membrane replacements.
Best Practices for RO System Operation
Avoiding Common Operational Mistakes
Running at too high a recovery rate is one of the most common mistakes. You push recovery to cut waste, but scaling happens fast. Minerals build up on the membrane surface and clog pores. Your filtration quality suffers, and you pay for expensive cleanings.
Temperature changes create another hidden issue. Water flow goes up about 2.7% for each degree Celsius the temperature rises. Many industrial plants see seasonal temperature swings. You must keep adjusting pressure to keep output steady. Ignoring these changes leads to uneven permeate flow and wasted energy.
Establishing a Maintenance Schedule
You need a regular cleaning plan based on clear triggers. Watch normalized permeate flow, salt passage, and differential pressure. When normalized permeate flow drops significantly below baseline, plan a cleaning. At a larger drop, treat it as urgent. A significant increase in salt passage points to concentration polarization or membrane damage. A significant rise in differential pressure shows particulate fouling in feed channels. These signs give you a clear view of system health.
Cleaning frequency depends on feed water quality and system monitoring. Surface water systems often need more frequent cleaning than well water systems. These numbers assume properly designed pretreatment.
Your best settings depend on your site. Base every change on a full feed water analysis and membrane maker guidelines. These good maintenance steps protect your investment. Advanced optimization methods combine monitoring data with regular upkeep. Your recovery rate, pressure settings, and cleaning times all work together. Following these best practices for ro system operation keeps your system running at top efficiency. Steady operating routines extend membrane life and cut downtime.
The best settings for a high-capacity reverse osmosis machine are feed pressure between 150-300 PSI, recovery rate between 50-90% (typical 75%), and pH between 6 and 8. These settings work together. If you raise recovery, you need more antiscalant. Changing one setting changes the others.
The best operators use real-time monitoring and normalized performance data. This data-based method gives clear benefits: longer membrane life, less energy use, less water waste, and more reliable operation. You avoid fixing problems after they happen by making changes before they start.
Check your current industrial reverse osmosis system against these best practices. If you do not have a monitoring plan, put one in place. Your filtration efficiency and membrane lifespan depend on this. Start today.
FAQ
How often should I clean my reverse osmosis membranes?
Clean your membranes when normalized permeate flow drops significantly below baseline. A larger drop means cleaning is urgent. Surface water systems often need more frequent cleaning than well water systems. Watch differential pressure and salt passage for extra clues.
What happens if my feed pressure exceeds 300 PSI?
Pressure above 300 PSI permanently speeds up membrane compaction. This damage lowers flux and salt rejection. You cannot undo it once it happens. Your membrane will need replacement sooner. Keep pressure in the 150-300 PSI range to protect your equipment and keep performance steady.
Why does my permeate flow decrease during winter months?
Cold water is thicker and harder to push through the membrane. Permeate flow changes about 1.5% per degree Fahrenheit. A 10-degree drop cuts your output by roughly 15%. You must raise feed pressure to make up for seasonal temperature changes.
What is the ideal pH range for my feed water?
Thin-film composite membranes work best between pH 6 and 8. This range keeps the membrane surface stable and stops scaling. pH outside this range lowers salt rejection and shortens membrane life. Check pH often and adjust pretreatment dosing when needed.
How do I know if my antiscalant dosing is correct?
Base your dosing on a full feed water analysis. Typical dosing ranges from 0.5 to 4 mg/L. Your recovery rate and water chemistry decide the right amount. Test your feed water regularly and adjust dosing when conditions change. Proper dosing prevents scaling and extends membrane life.






 English
 Chinese
 German
 Russian
 Japanese
 French
 Dutch
 Italian