









You can look at your water test numbers through water testing and analysis. You should compare them to the safe limits. It is important to know what each contaminant means for your health. Water testing and analysis helps you stay safe. It shows if your water has bad substances. Only 9% of homes in the United States test their water every year. This means you are already doing better than most people. Some common problems are lead, E. coli, and nitrate. These can cause health issues.

Key Takeaways
Test your water every year to keep it safe and find problems early.
Look at your water report and check for health risks first, like lead and nitrates.
If your test shows high contaminant levels, use safe ways to treat your water, like boiling or filtering.
Write down your water test results so you can see changes and keep your water good over time.
Talk to a water quality expert if your water tastes or smells different, or if your test results are not normal.
Water Testing and Analysis Basics

Why Test Your Water
Testing your water keeps you and your home safe. Water testing and analysis can show if your water has bad things in it. Many people check for lead, iron, magnesium, arsenic, nitrates, and bacteria. These things can make you sick or hurt your pipes. Water testing and analysis helps you find problems early. This can save you money on repairs.
Tip: If you test your water often, your family stays safe and your house stays in good shape.
Experts say you should test private wells and city water at different times. Look at the table below to see how often to test for each contaminant:
Contaminant | Testing Frequency |
|---|---|
Coliform Bacteria | |
Nitrate | Test at first, then every 5-10 years if under 2 mg/L |
Arsenic | Test one time, then every year if arsenic is found |
Lead | Test once if your house has copper pipes from before 1985 |
VOCs | Test every 5-10 years or if you smell or taste solvent or gasoline |
Private wells can have nitrates, bacteria, salt, metals, and radon. These can get in from farms, broken well covers, road salt, or nature.
What a Water Analysis Report Includes
After you test your water, you get a report. The report shows results for different things in your water. You can use this report to see if your water is safe or if you need to fix something.
A normal water analysis report has three main parts:
Category | Description |
|---|---|
These are things that can hurt your health. The report shows safe limits and health risks. | |
General Water Quality Indicators | These show if there are harmful things, like turbidity or pH problems. |
Nuisance Contaminants | These do not make you sick but can taste bad or stain things. |
You can look at your water test report and compare your results to safe numbers. This helps you know if your water is good or if you need to make changes.
Key Parameters in a Water Analysis Report

To understand your water report, you need to know the main parameters. These parameters show if your water is safe to drink and use.
Health-Related Contaminants
Always check health-related contaminants first. If these go above safe levels, they can cause serious health problems. The most common health-related contaminants in home water are:
Lead
Chlorine
Iron
Arsenic
Hydrogen sulfide
Nitrate
Bacteria and viruses
Pharmaceuticals
PFAS
Chloride
The Environmental Protection Agency (EPA) sets limits for some contaminants. Here are the limits for a few important ones:
Contaminant | EPA Enforceable Limit |
|---|---|
Arsenic | 10 ppb |
Lead | 15 ppb |
Nitrate | 10.0 mg/L |
If your test results are higher than these numbers, you should act fast.
General Water Quality Indicators
General water quality indicators show how safe and clean your water is. These indicators do not always mean there is a health risk. They help you spot changes or problems early. Important indicators are:
Dissolved Oxygen (DO)
Turbidity (clarity)
Bioindicators (living organisms)
Nitrates
pH
Water Temperature
You can use these indicators to watch water quality over time. For example, drinking water pH should be between 6 and 8.5. Hardness and total dissolved solids (TDS) are also important:
Parameter | Acceptable Range |
|---|---|
pH | 6 – 8.5 |
Hardness Classification | Range (ppm) |
|---|---|
Soft | 0–60 |
Moderately Hard | 61–120 |
Hard | 121–180 |
Very Hard | 180+ |
Parameter | Acceptable Range (ppm) |
|---|---|
TDS | 50 – 200 |
EPA MCL | 500 |
Nuisance Contaminants
Nuisance contaminants do not usually make you sick. They can cause stains, bad smells, or strange tastes. Common nuisance contaminants are:
Total coliform bacteria from waste
Disinfection byproducts from chlorine
Iron, which makes reddish-orange stains on sinks and laundry
Manganese, which leaves dark brown or black stains and can clog pipes
Note: High iron and manganese can hurt plumbing and appliances. You may see stains or notice lower water pressure.
By checking these water quality parameters, you can keep your water safe and your home in good shape.
Interpreting Your Water Analysis Report
Comparing Results to EPA and Local Standards
You should check your water report against EPA and local standards. These standards tell you if your water is safe. Follow these steps:
Use correct water testing methods. This gives you good results.
Make sure the lab used quality checks. This means your results are solid.
Check if the testing follows EPA or local rules. This keeps your results safe.
Look at your report numbers. Compare them to safe limits for each contaminant.
If your numbers are higher than safe limits, you need to do something. You can find safe limits on the EPA website or from your local water office. Doing this helps you understand your water test results.
Tip: Keep your reports. They help you see changes in your water over time.
Understanding Units, Ranges, and Trends
Water reports use different units to show how much stuff is in your water. You need to know these units to read your report right. Here is a table to help you:
Unit | Description | Interpretation |
|---|---|---|
PPM | Parts per million | Shows how many parts of a contaminant are in a million parts of water. 1 PPM = 1 mg/L. |
PPB | Parts per billion | Shows how many parts are in a billion parts of water. 1 µg/L = 1 PPB. |
PPT | Parts per trillion | Shows how many parts are in a trillion parts of water. 1 ng/L = 1 PPT. |
CFU/mL | Colony formation units per milliliter | Measures living cells in one milliliter, used for bacteria. |
Check the safe range for each thing in your report. Safe ranges are usually listed. If your result is close to the top or bottom limit, pay attention.
Watching trends is important for water quality. Compare your current report to old reports. If a contaminant keeps going up, there could be a problem. The Water Quality Index (WQI) helps you see changes over time. If your WQI gets better, your water is improving. If it gets worse, you may need to fix something.
Note: Keeping reports for years gives you a clear view of your water quality.
Detectable vs. Non-Detectable Results
Sometimes your water report says “non-detectable” or “ND.” This means the lab did not find enough of the substance to measure. Here is what you should know:
Aspect | Explanation |
|---|---|
Definition | Non-detects mean the amount is below what the lab can find. |
Data Interpretation | These results make math with your data harder. |
Common Reporting | Labs often write results as less than a number, like “<1”. |
Consequences of Exclusion | Leaving out non-detects can give you the wrong idea about your water. |
Importance in Hypothesis | Non-detects show how much of your data is below the reporting limit. |
If your report shows a small or borderline amount of a contaminant, do not ignore it. Even tiny amounts of some substances, like pharmaceuticals or chemicals, can hurt your health. The EPA sets risk levels for cancer and other health problems. If your risk is higher than 1 in 10,000, you should act.
Alert: Always watch for trace levels of dangerous contaminants. Acting early can keep you healthy.
Actions for Abnormal Results
Immediate Steps for Health Risks
If your water test shows something above safe levels, act fast. Do not drink or cook with the water until it is safe. Listen for news from your local water company or health department. They might tell you what to do next.
If germs or chemicals get in your tap water, follow advice from your water company or health officials. Sometimes, they will give a drinking water warning. Read the warning to know how to stay safe and not get sick.
Use bottled water for drinking and cooking until the problem is fixed.
Treatment and Solutions
You can use some quick fixes to make your water safer right away. Here are some ways to do that:
Method | Description |
|---|---|
Boiling | Boil water for 1 minute (3 minutes if you live high up) to kill germs. |
Chemical Disinfectants | Use bleach (1% sodium hypochlorite) or special tablets to clean the water. |
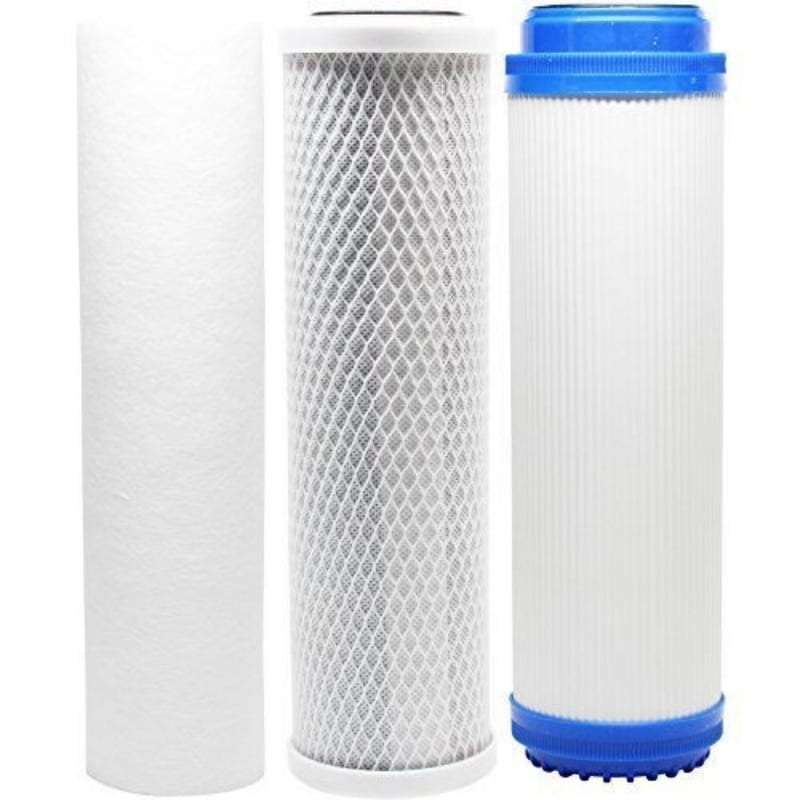
Filtering | Use portable filters with the right size holes to take out bacteria and parasites. |
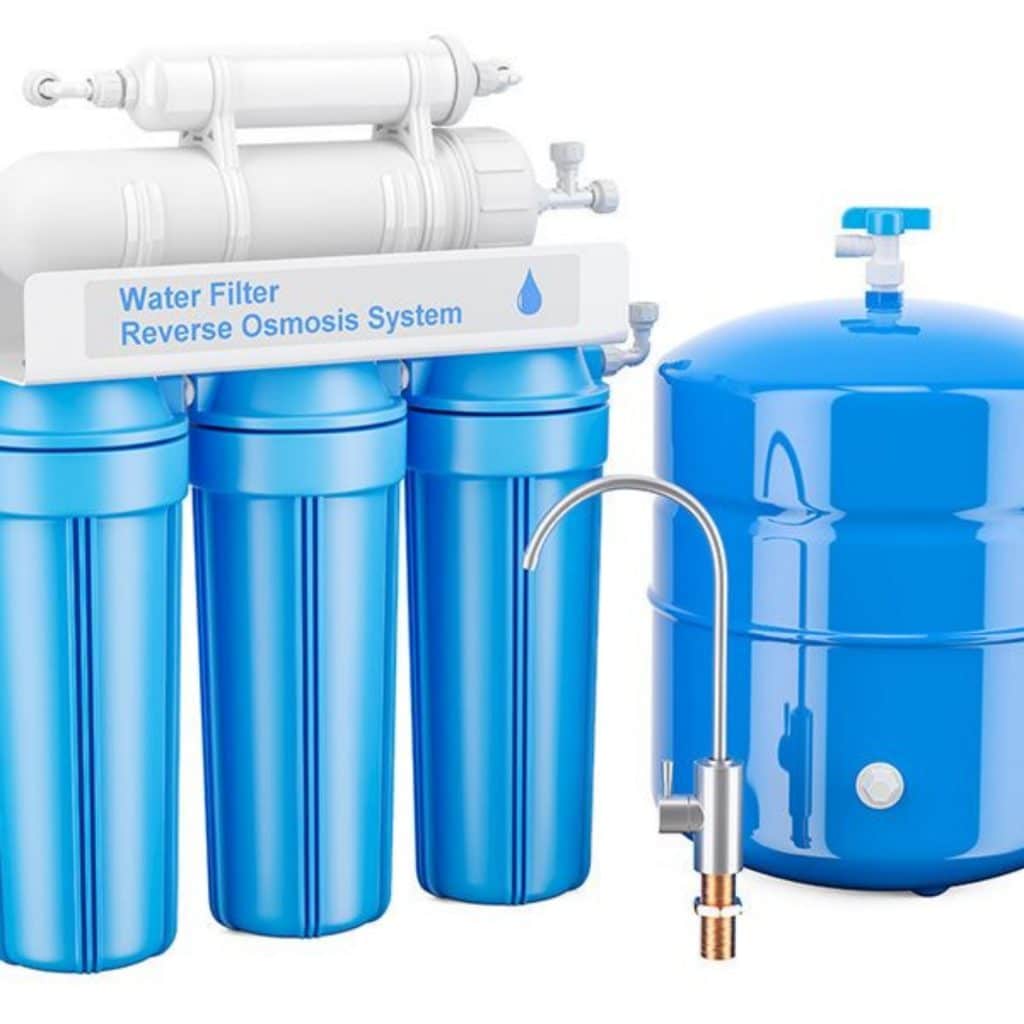
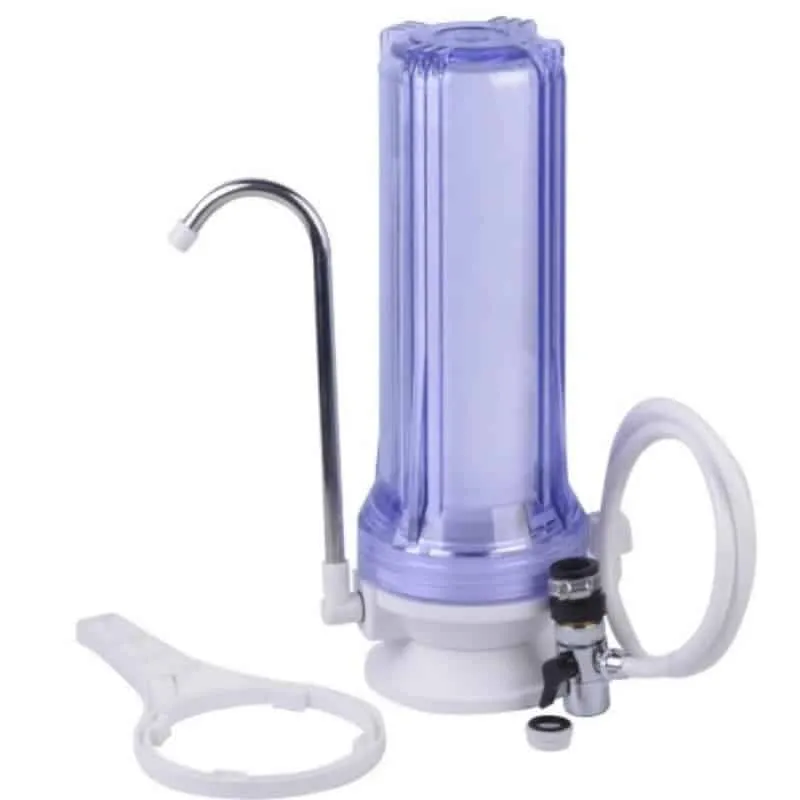
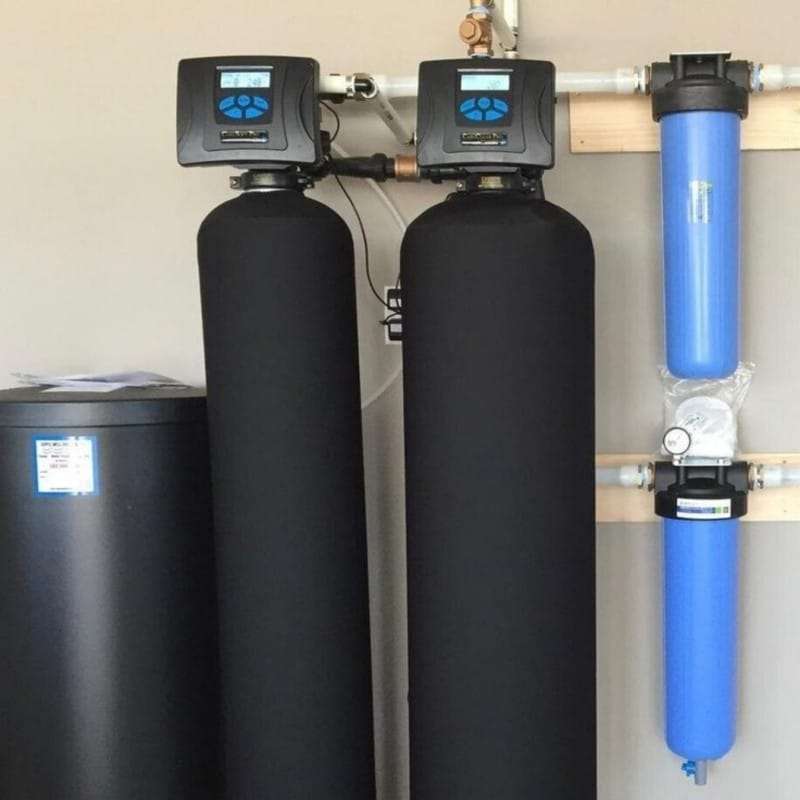
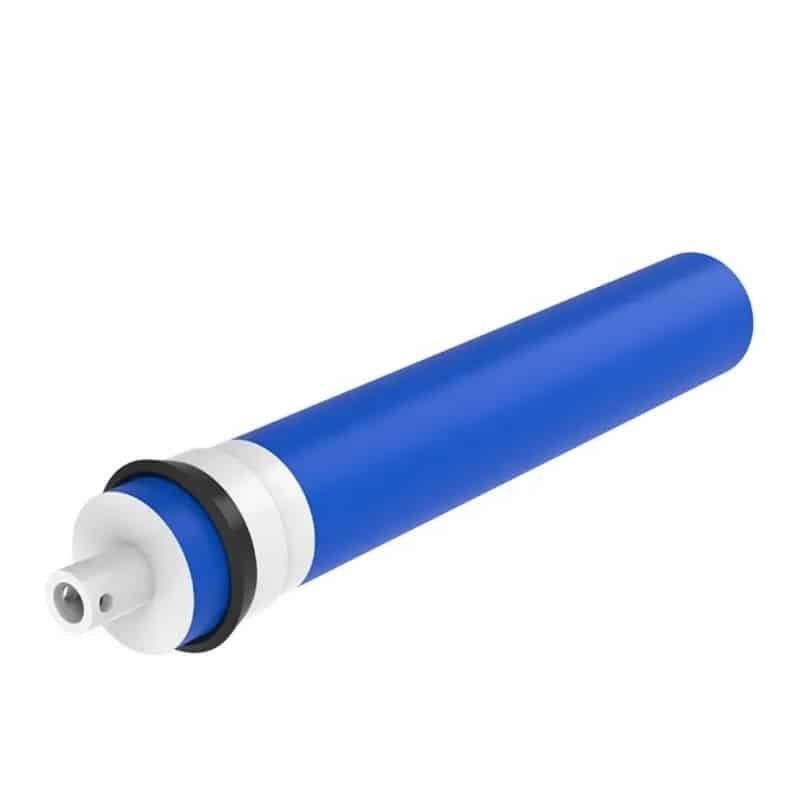
For long-term safety, you can put in water treatment systems. Point-of-use filters are good for taking out lead. Lead is very dangerous, especially for kids and pregnant women. Pick filters that meet NSF/ANSI standards 53 or 58. These standards mean the filters can take out bad things. Some advanced systems, like the Multipure Aqualuxe, can remove almost all bacteria and viruses.
Water treatment systems can last 10 to 20 years if you care for them. Keep them working well by doing regular checks and getting help from a professional.
When to Consult a Professional
Sometimes you need an expert to help with water problems. Call a certified water quality professional if you have these issues:
When to Consult a Professional | Reason |
|---|---|
After getting abnormal test results | This could mean your water has something bad in it. |
If you notice changes in taste, smell, or look | This might mean your water source changed or got dirty. |
After fixing or working on your well system | This makes sure your water is still safe after repairs. |
You can find experts and help from these groups:
Watercheck: Gives water testing for homes and businesses.
ABC Testing: Offers certificates and study guides for water treatment.
WEF: Gives training and certificates for water workers.
State-Specific Guide: Lists labs and health departments in your state.
Doing these things keeps your family safe and your water clean.
Tracking and Maintaining Water Quality
Using Reports to Monitor Trends
You can use your water test reports to spot changes in your water over time. When you collect results every year or even every month, you build a record that helps you see patterns. This record lets you notice if something starts to go wrong before it becomes a big problem.
Regular monitoring, especially over many months or years, helps you find long-term trends.
Collecting results less often but over a longer time works better for spotting changes than testing a lot in a short time.
Looking at many results from the same place over several years shows if changes in your water are real.
Keeping a long-term record of your water tests gives you many benefits:
You show that your home meets safety rules, which can help your property value.
You protect your family’s health by catching problems early.
You keep your plumbing safe and avoid expensive repairs.
Tip: Store your reports in a folder or on your computer. This makes it easy to compare results and share them with experts if you need help.
When to Retest and How Often
You should test your water every year, especially if you use a private well. The EPA and the National Ground Water Association both recommend annual testing for bacteria, nitrates, and other local risks. Test your water right away if you notice a change in taste, smell, or color. You should also retest after floods, storms, or any work on your well.
Test your private well each year for bacteria, nitrates, total dissolved solids, and pH.
Retest if you see any changes in your water, like a new odor or color.
Test again after natural disasters or repairs near your water source.
If you live in an area with known contamination, test more often.
Some people do not test their water because they do not know how or where to start. Free testing programs and reminders can help you remember to check your water. You can ask your local health department for advice or look for educational events in your area.
Remember: Regular testing keeps your water quality safe for you and your family.
You can figure out your water report by checking each indicator. Compare your results to the safe limits in the table below. This table shows what each number means for your water:
Indicator | Acceptable Limit | What It Means |
|---|---|---|
pH value | 6.5–8.5 | Taste and safety |
Turbidity | <5 NTU | Clarity |
TDS | 500 mg/l | Hardness, staining |
Chlorides | 250 mg/l | Taste, corrosion |
Copper | 1.3 mg/l | Stains, taste |
Iron | 0.3 mg/l | Stains, taste |
Manganese | 0.05 mg/l | Stains, taste |
Sulfates | 250 mg/l | Feel, health |
Hardness | varies | Soap use, buildup |
Check your water results every year. Look for any changes in your numbers. Groups like the Bureau of Reclamation and National Watershed Coalition can help you keep your water safe. Always pay attention and act to protect your water and health.
FAQ
How often should you test your water?
You should test your water at least once a year. If you notice changes in taste, smell, or color, test right away. After repairs or floods, test again to make sure your water stays safe.
What do you do if your water test shows high lead?
Stop drinking the water. Use bottled water for cooking and drinking. Install a certified filter for lead removal. Contact a water professional for help. Always protect children and pregnant women from lead.
Can you test your water at home?
Yes, you can use home test kits for basic checks like pH, hardness, or chlorine. For more accurate results, send a sample to a certified lab. Labs can test for more contaminants.
Where can you find safe water limits?
You can find safe water limits on the EPA website or from your local health department. Your water test report may also list these limits for each contaminant.








 English
 Chinese
 German
 Russian
 Japanese
 French
 Dutch
 Italian