




To find the ROI for an industrial reverse osmosis system, use this formula: ROI = (Net Profit / Initial Investment) x 100. Net profit is total gains minus total expenses over the machine’s life. For a typical 500m³/day facility, the payback period is 3–7 years. This guide covers upfront costs, operational aspects, hidden costs, and a worked example to show how each factor affects the final number. You will see the economic benefits and cost savings from water treatment improvements, and learn how to calculate your own payback period. Accurate calculations depend on realistic estimates of all costs, so be thorough.
Key Takeaways
Figure out ROI with the formula (Net Profit / Investment) x 100. Net profit is total savings minus total costs over the machine’s life.
Include all costs from the start: equipment, installation, membranes, and pretreatment. Do not forget hidden costs like membrane replacement, downtime, and disposal fees.
Using a reverse osmosis system helps you save money on water, energy, and chemicals. Cutting waste and lowering maintenance costs can also boost your returns.
Try to get your money back in 2 to 4 years. Getting it back in under 2 years is great. If it takes over 5 years, you should look at it closely.
Keep track of what you save and spend each year. Update your ROI with real numbers to protect your investment and see the real benefits.
The Return on Investment Formula
You need two numbers to check any industrial water treatment purchase. The first is your total investment. The second is your net profit over the machine’s life. The return on investment formula puts these together into one percentage. That percentage tells you if the project makes financial sense.
Net Profit Divided by Investment Cost
Two versions of the same equation show up in capital planning documents. The first version says: ROI = (Net Profit / Cost of Investment) x 100. The second version says: ROI = (Savings – Cost) / Cost × 100%. Both give you the same result. The difference is how you label the numerator.
Net profit equals total savings minus total costs over the system’s working life. This definition matters because a reverse osmosis system creates value over many years, not just the first one. You find annual net savings by subtracting the RO plant annual operating cost from your current annual water and maintenance cost. Then you multiply that number by the expected service life.
Annual Net Saving = (Current Annual Water and Maintenance Cost) − (RO Plant Annual Operating Cost)
Net Profit = (Cost savings from water production – Operational costs) x Time period
The water treatment ROI monitoring calculation follows a simple formula: Annual Savings = Chemical Savings + Labor Savings + Emergency Avoidance Costs + Operational Stability Benefits. Your ROI percentage equals Annual Savings minus System Cost, divided by System Cost (multiplied by 100).
Why the Percentage Guides Capital Decisions
A positive ROI tells you the project gives back more than it uses. A reasonable payback period tells you how fast that happens. Decision makers focus on these two figures because they turn technical performance into financial language that capital committees understand.
The ROI percentage works as a decision gate. A worked example shows that if a base case gives a 2.8-year payback, stress-testing it under conservative assumptions (benefits 30% lower, project 20% over budget) stretches payback to 4.1 years — still inside a typical 5-year infrastructure approval threshold. The key test is whether the downside scenario still clears the firm’s hurdle rate. If it does, the capital committee can approve with confidence.
Systematic measurement pays off. According to the Equipment Leasing and Finance Association, U.S. businesses invest about $1.9 trillion each year in equipment, software, and related assets. Companies that measure equipment ROI systematically report 23% higher returns on equipment investments than those that don’t track performance.
Your cost analysis should also count avoided losses. Downtime events cost between $50,000 and $2,000,000 per failure. A 15% annual failure probability multiplied by $400,000 equals $60,000 in expected annual loss. These avoided-loss figures raise the ROI percentage and strengthen your case.
The economic benefits of a reverse osmosis system go beyond simple water savings. Regulatory compliance savings, energy reductions, and operational stability all feed the numerator. Each benefit you quantify makes the final percentage more defensible during budget reviews.
Step 1 — Initial Industrial Reverse Osmosis Costs

Your cost analysis begins with the money you spend before the machine makes any clean water. The cost varies by system size. The table below shows typical cost ranges for different industrial system capacities.
System Size (GPD) | Cost Range | Notes |
|---|---|---|
Under 5,000 | $15,000–$50,000 | For smaller commercial applications; installation not included. |
50,000–100,000 | $100,000–$300,000 | For medium-scale industrial use; excludes installation and auxiliary equipment. |
500,000 and above | Often exceed $1 million | Large-scale systems; installation and pre-/post-treatment are additional. |
These ranges cover only the RO skid. Your total project cost will be higher.
Equipment, Membranes, and Pre-Treatment
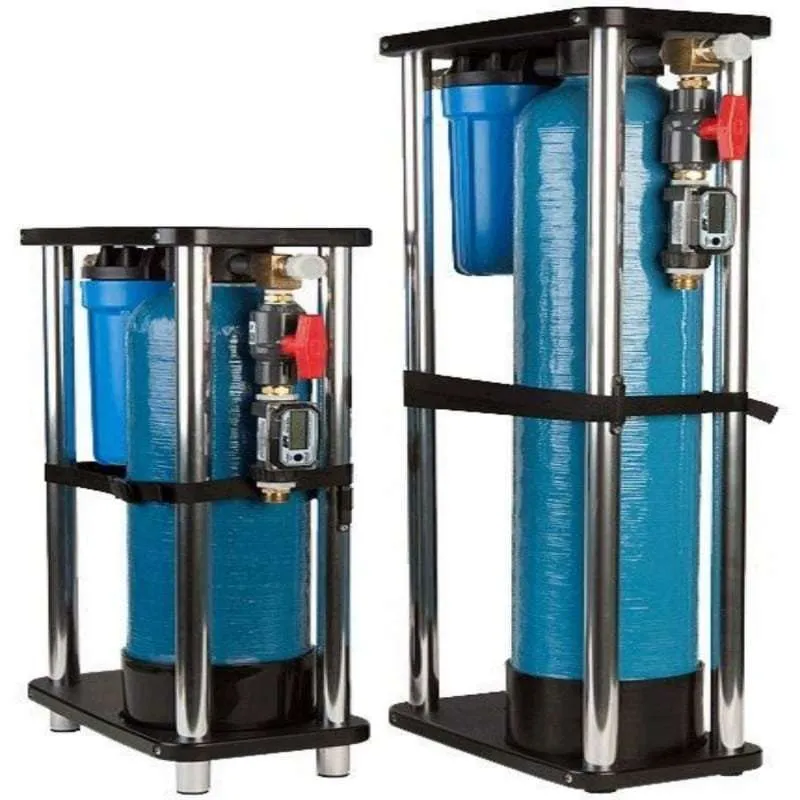
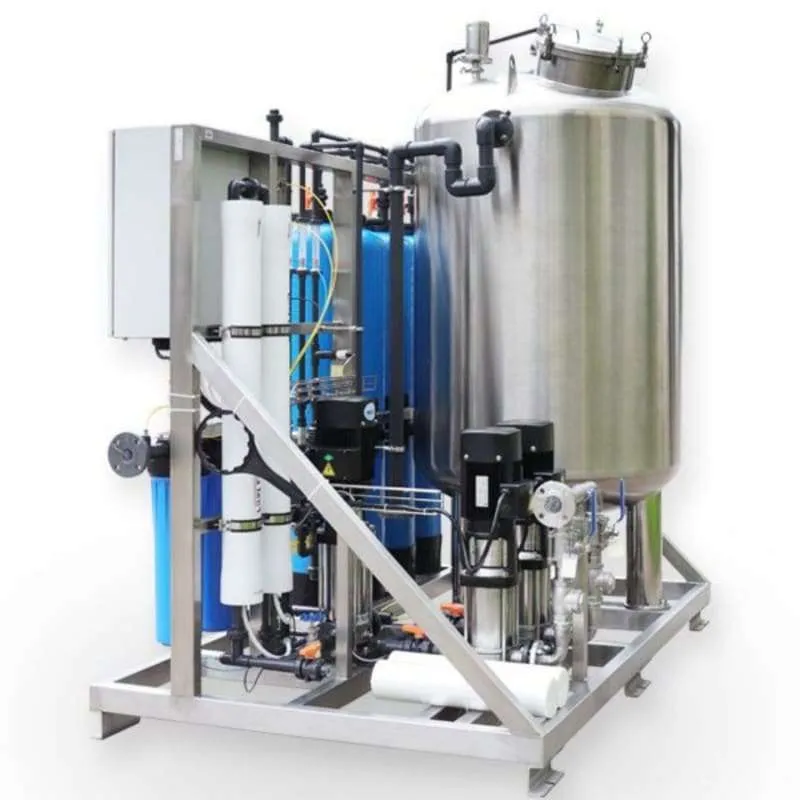
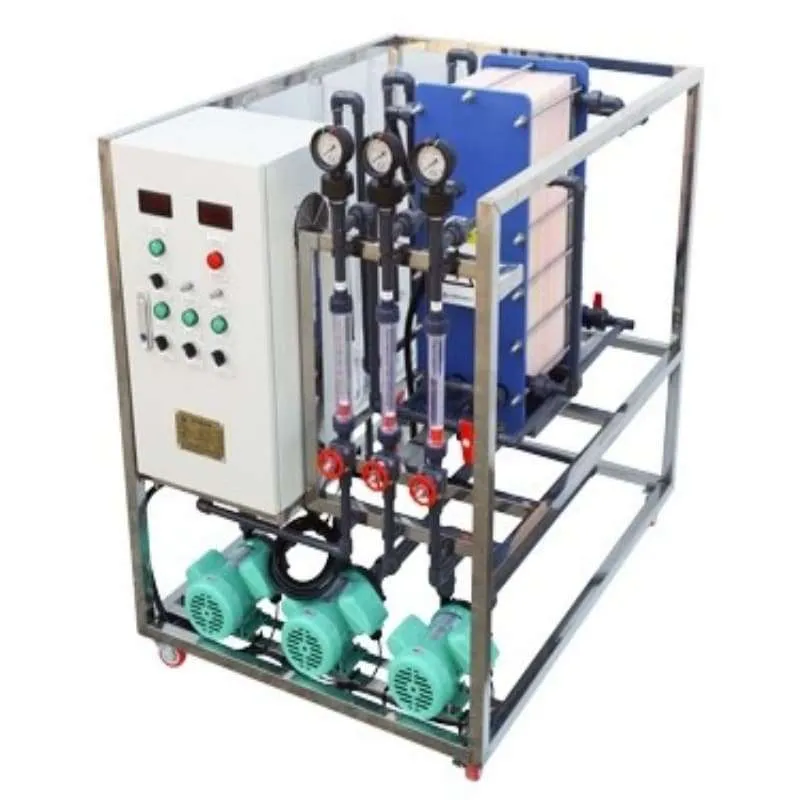
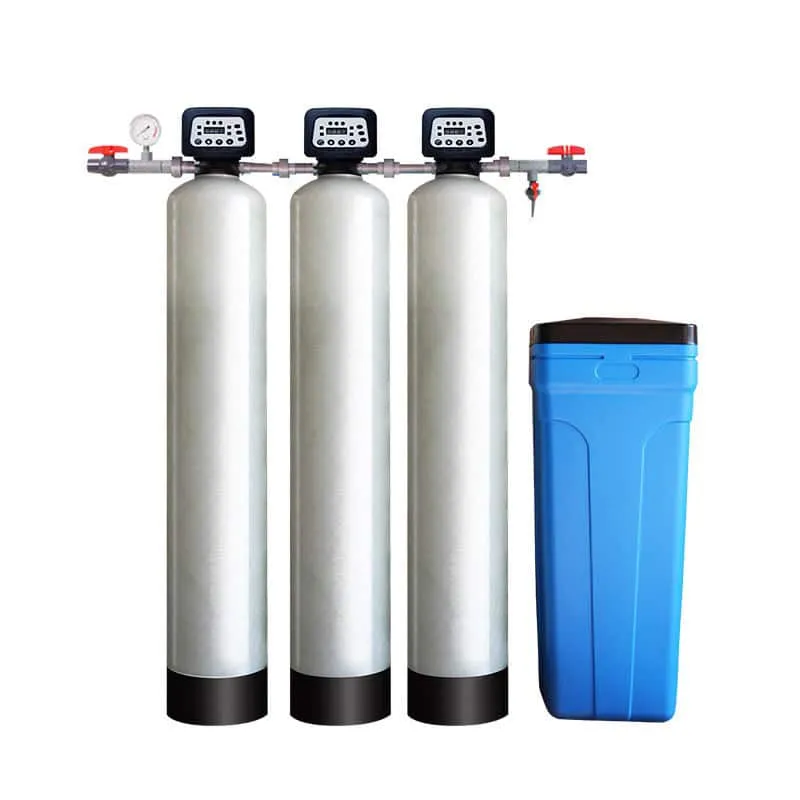
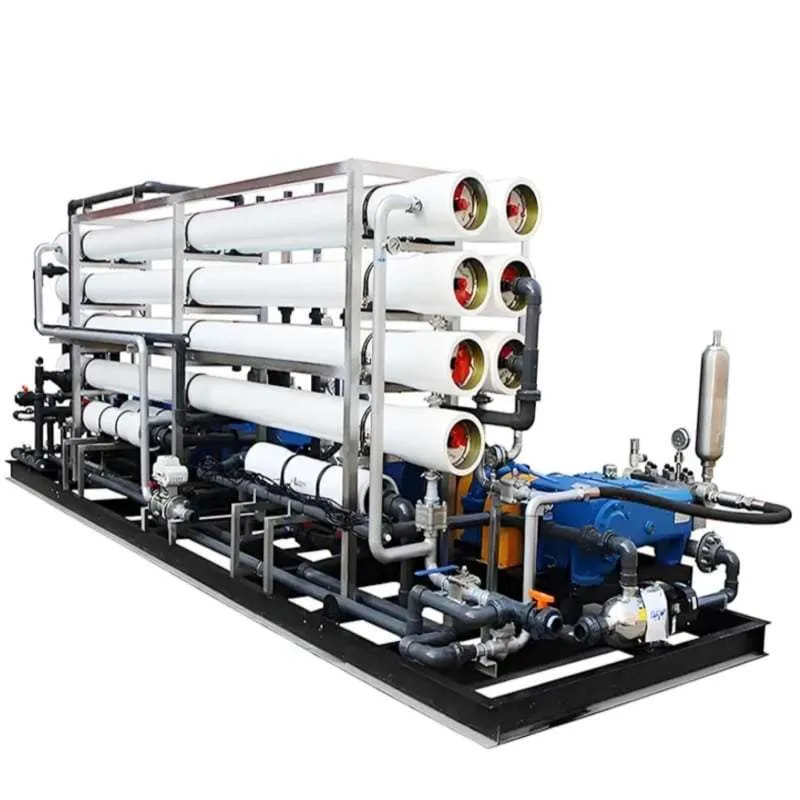
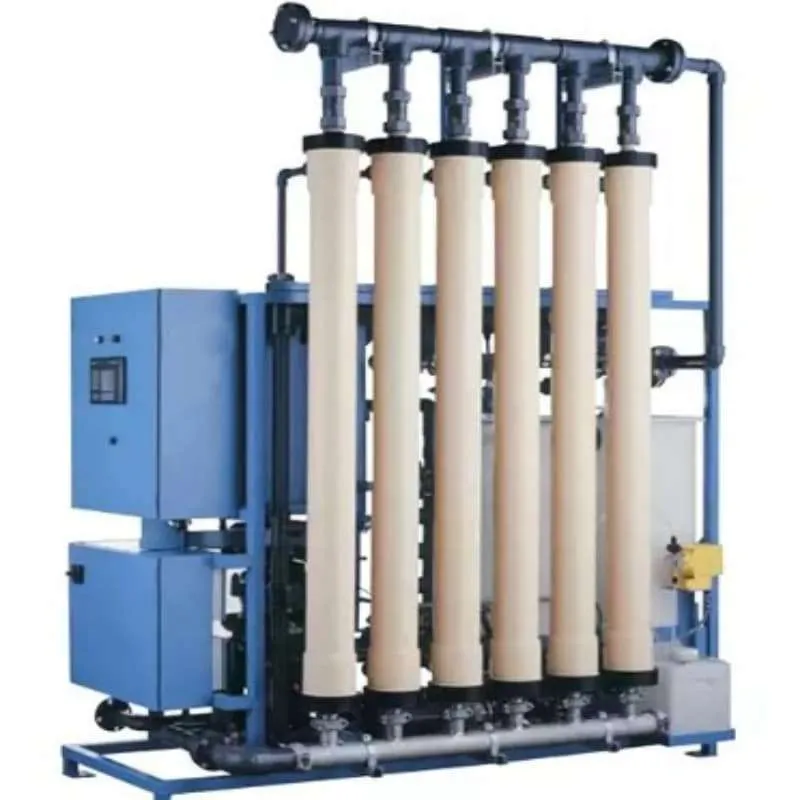
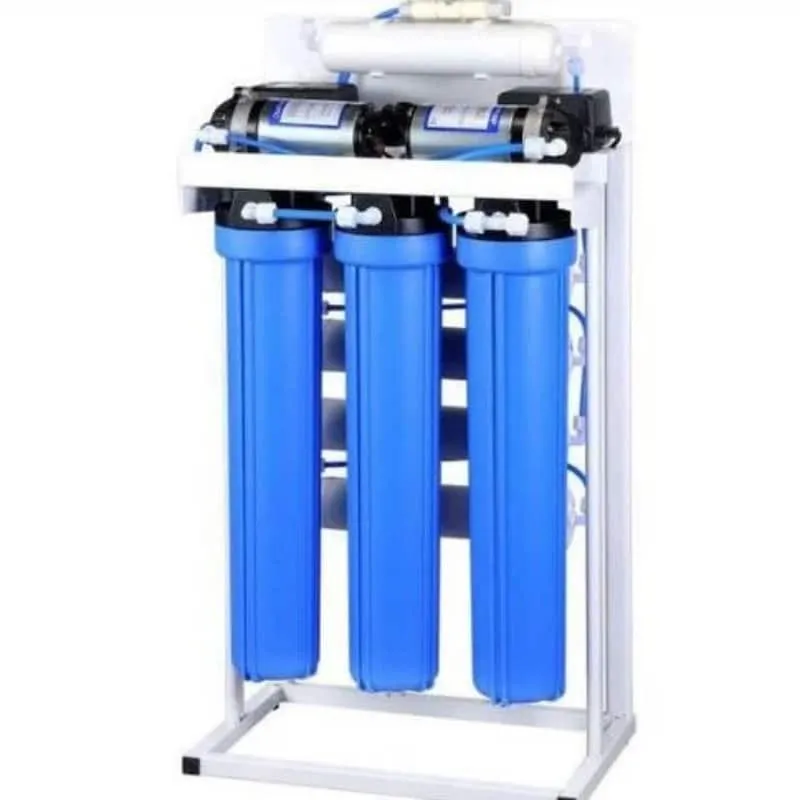
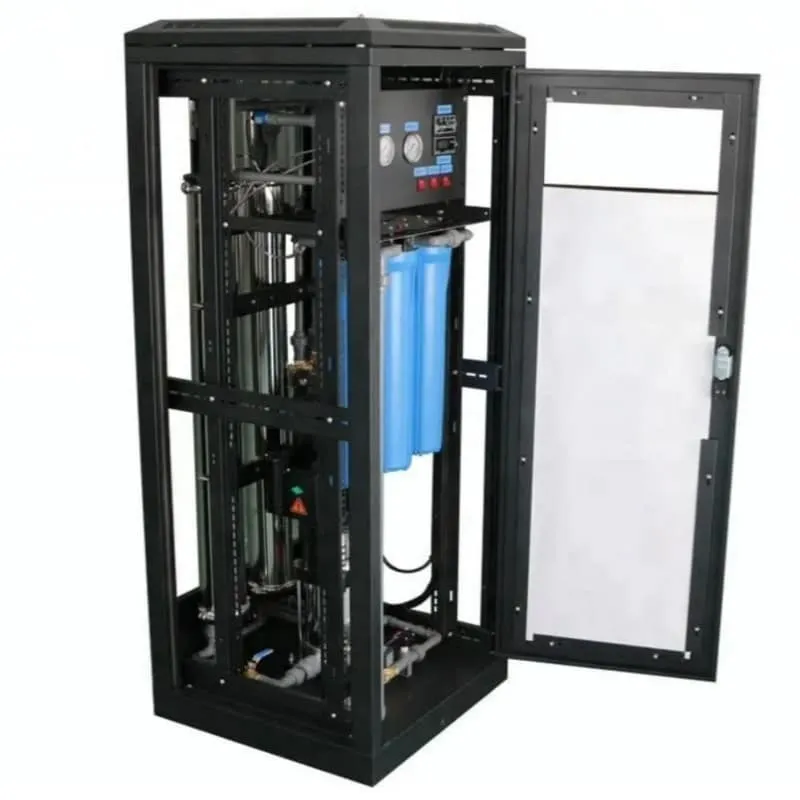
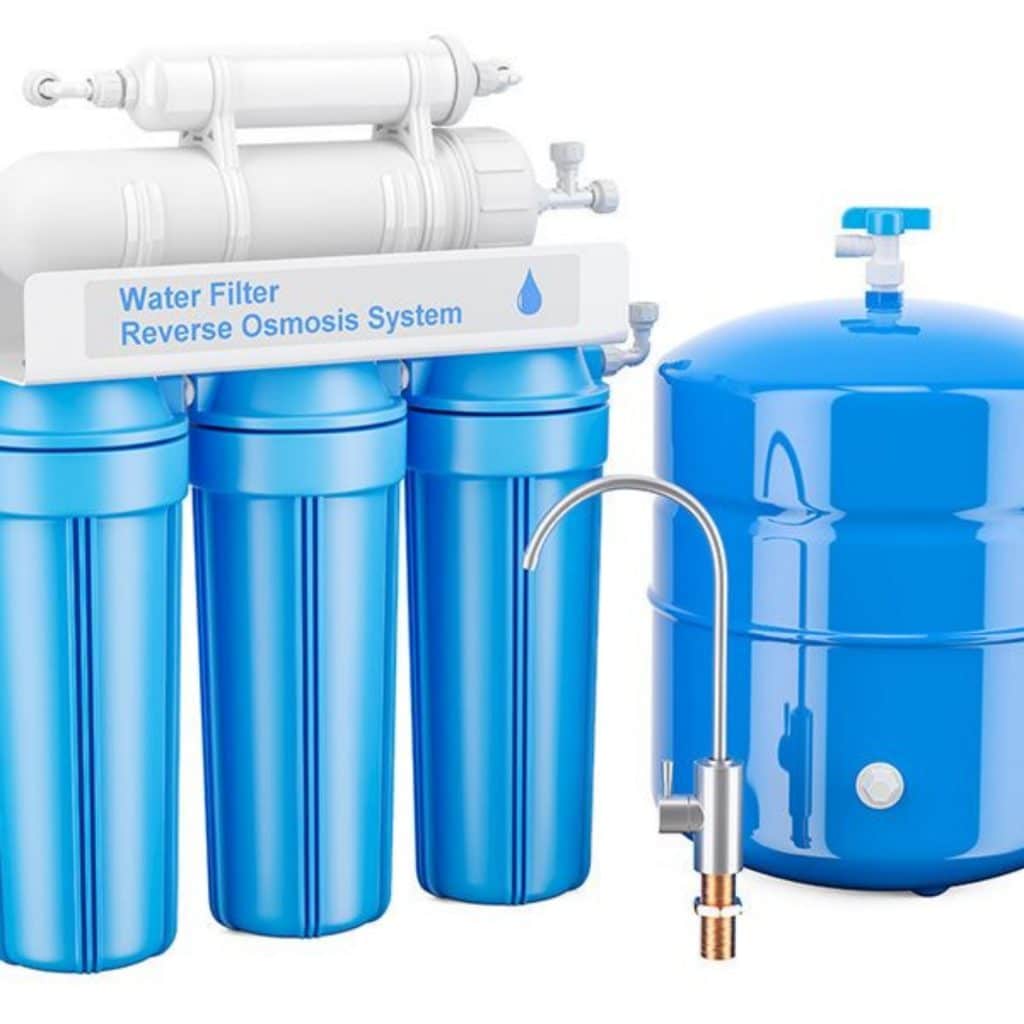
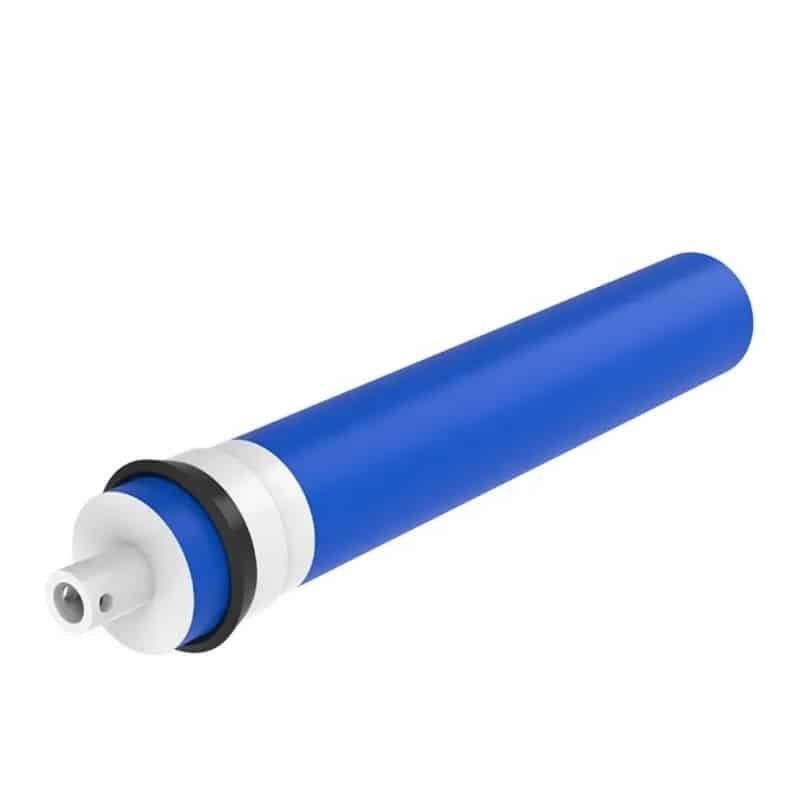
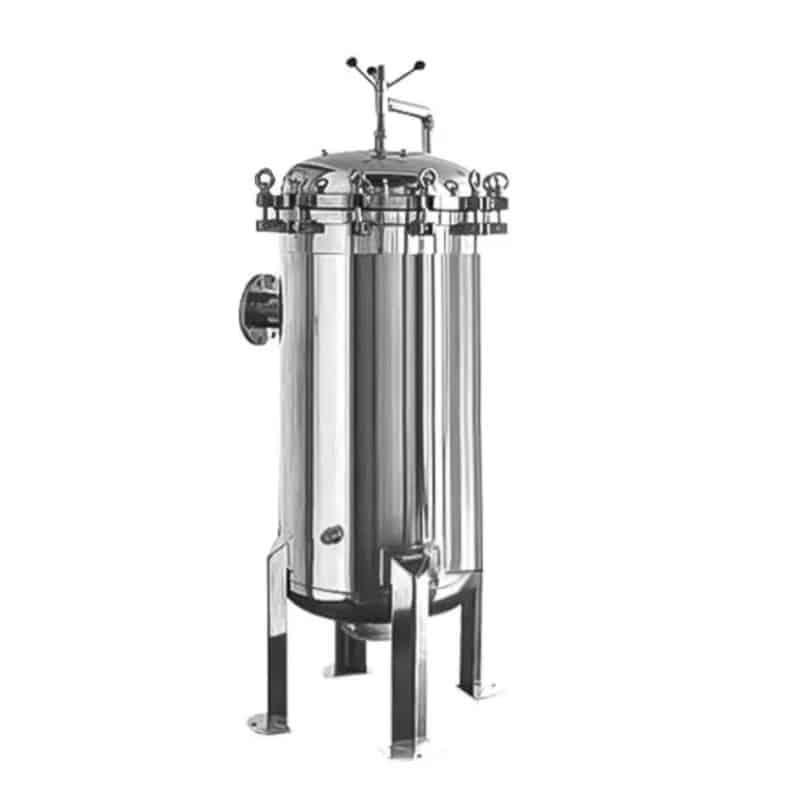
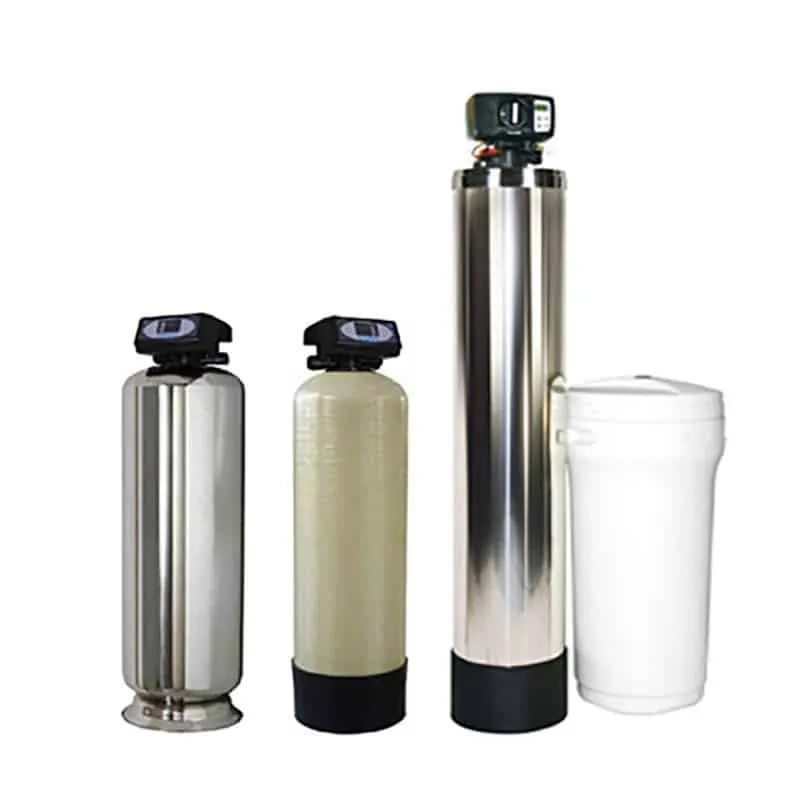
The main industrial reverse osmosis unit has membranes, pre-treatment parts, and the housing that holds them. Membrane quality changes both how well it works and how much it costs. Pre-treatment gets more complex when feedwater quality is poor. A 50m³/hour (about 317,000 GPD) industrial reverse osmosis system has an upfront cost of $100,000–$500,000. That price covers the core RO unit plus auxiliary equipment like pre-treatment, pumps, and control panels.
Every dollar you spend here becomes the bottom number in your ROI formula. A bigger bottom number lowers your return percentage for any given savings. You must track each line item carefully.
Installation, Pumps, and Automation
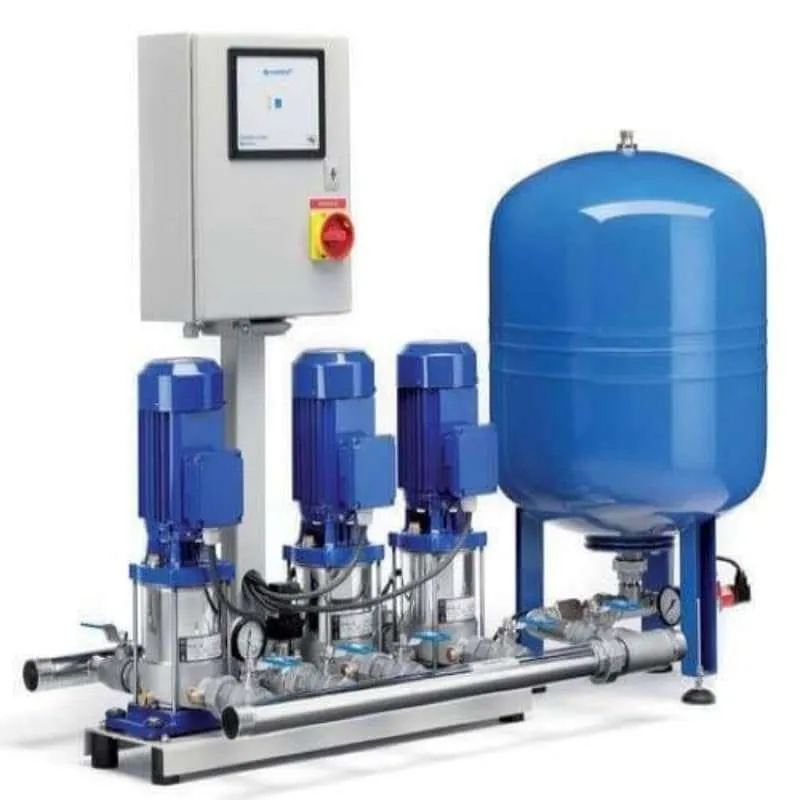
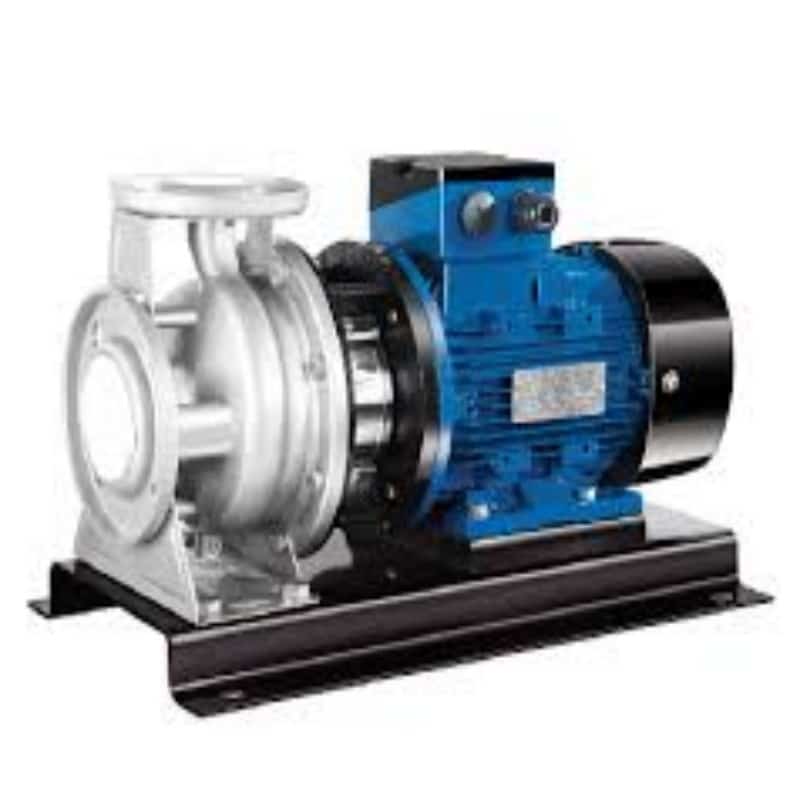
Installation and commissioning costs add to your initial investment. Pumping and energy recovery equipment also raise the total. Automation level is another cost driver. A fully automated reverse osmosis system costs more upfront but may cut labor and downtime later.
Your water treatment budget must include these items. The benefits of a lower upfront cost option may vanish if you face higher operating expenses. A complete cost picture helps you avoid surprises. You need this number before you can figure out any savings or payback period.
Step 2 — Operational Savings From a Reverse Osmosis System

Water, Energy, and Chemical Reductions
Your current water bill gives you a starting point. A reverse osmosis system can significantly reduce monthly water expenses, resulting in direct savings. These cost savings come from three main areas: using less water, using less energy, and needing fewer chemicals.
The RO process gets more usable water out of the same source. So you use less water overall. Energy savings come from modern high-efficiency pumps and energy recovery devices. Chemical use drops because the process removes contaminants without adding heavy chemicals. Key inputs for your calculator include local energy costs, cleaning frequency, membrane lifespan, and total water savings. Each input changes the final number, so accurate estimates matter. Your water treatment budget depends on these variables, so be thorough.
Waste Disposal and Maintenance Savings
Waste disposal costs drop a lot with the right system design. A closed circuit reverse osmosis (CCRO) setup cuts wastewater volume by 50% to 80% compared to a traditional system. It also uses 20% to 35% less energy. The leftover brine can go to a lower-cost disposal facility. Some plants without sewer access must truck wastewater offsite. A CCRO approach means you need that truck less often, which lowers your monthly hauling bill. This is an important part of your cost analysis.
Maintenance costs also favor this system type over other methods. The table below shows the comparison.
Aspect | RO | Ion Exchange |
|---|---|---|
Upfront cost | Higher due to complex filtration | Lower initial cost |
Long-term operating cost | Lower over time | More expensive over time |
Maintenance needs | Less maintenance; periodic membrane cleaning | Resins need regular regeneration or replacement |
Key cost driver | Membrane cleaning and replacement | Resin replacement |
Factors affecting cost | Water quality, usage, system design | Water quality, usage, system design |
An industrial reverse osmosis system setup usually needs less maintenance than ion exchange. Membranes need cleaning and replacement from time to time, but you can predict when. That makes it easy to budget for those events. Ion exchange resins need regular regeneration. That adds operational costs and downtime. The long-term economic benefits become clearer when you compare these maintenance profiles. Your evaluation should include the expected membrane lifespan and the avoided costs from resin regeneration.
The total cost savings from waste disposal and maintenance often beat the water savings alone. That makes the full picture of benefits stronger for your investment decision. The operational costs of this system are lower than many alternatives, which improves your ROI calculation. A proper water treatment plan accounts for these operational savings. These cost savings make the system an attractive option.
Step 3 — Hidden Costs That Erode ROI
Your ROI projection might look good on paper. But hidden costs can shrink that number fast. You need to count them before you figure out your final return.
Membrane Replacement and Downtime
Membrane replacement is the biggest repeat expense you will face. A reverse osmosis membrane array needs to be replaced every 3 to 7 years. The exact timeline depends on your feed water quality and pretreatment setup. With good pretreatment using ultrafiltration and carbon filtration, membranes last 3 to 5 years. High hardness and chlorine exposure cut that to under 2 years. The cost of replacement membrane elements can be significant. For a typical system, budgeting for periodic replacement is essential.
Unplanned downtime hits your bottom line even harder. A single o-ring failure in a large-scale installation can cause tens of thousands in losses. You pay for emergency labor, expedited parts, and lost production. You also face compliance issues if your discharge permit gets violated. Monitoring differential pressure across membrane stages gives early warning of developing seal issues. This lets you fix problems during planned downtime instead of emergency shutdowns.
Chemical Spikes and Disposal Fees
Chemical expenses spike when feed water quality changes. Your reverse osmosis system needs cleaning chemicals, antiscalants, and biocides. A sudden change in source water can increase your usage overnight. You must plan for these ups and downs.
Disposal fees for the brine stream are easy to miss. Your water treatment budget should include regular waste hauling charges. Some facilities without sewer access must truck wastewater offsite in tanks. This adds to your total expense.
Source water testing is another cost you cannot skip. You must test your feed water before picking equipment. Testing runs $3,000 to $8,000 depending on your source. Skipping this step leads to wrong equipment choices and poor performance.
Ignoring these hidden expenses inflates your projected ROI and lengthens your real payback period. Your investment will not deliver the returns you expect. A thorough analysis must include every item here. Only then can you calculate accurate cost savings for your facility. A water treatment plan that accounts for every expense gives you a realistic picture. The benefits of proactive maintenance show up in your final numbers. Your operational costs stay predictable when you plan for these expenses upfront. You protect your savings by budgeting for hidden charges from the beginning. A well-maintained reverse osmosis system delivers better long-term value.
Step 4 — A Worked ROI Example
Running the Numbers for a Mid-Size Facility
To calculate ROI, you need total investment and annual net savings. For a 500 m³/day industrial reverse osmosis plant, the typical payback period is 3 to 7 years. This range depends on local water costs, energy costs, and operational efficiencies.
Consider a base case with a 2.8-year payback. Under conservative assumptions—benefits 30% lower and project 20% over budget—the payback extends to 4.1 years, still within a typical 5-year infrastructure approval threshold. This stress test shows that even with adverse conditions, the investment can remain viable.

Payback Period and Total Cost of Ownership
The payback period tells you how fast you recover your investment. Use the formula: Simple Payback = Total Installation Cost / Annual Net Saving. For many industrial systems, a payback of 3 to 7 years is typical. A payback under 3 years is strong, as seen in the example with a 2.8-year base case.
A total cost of ownership approach accounts for energy, chemicals, consumables, labor, membrane replacement, and unplanned downtime. According to the US Department of Energy, water-related energy savings of 10% to 30% are achievable in most industrial sites through technology upgrades, which can improve the ROI.
Operational costs can exceed the initial investment over time, so it is important to update your ROI calculation annually with real data. A well-maintained reverse osmosis system delivers long-term savings and justifies the capital commitment.
You now have a four-step plan: add up your total investment, estimate your savings from running the system, subtract hidden costs, and use the ROI formula. Each step makes the picture clearer. A reverse osmosis system pays you back over many years, so treat the result as part of the total cost of ownership, not a one-time score.
Use your own facility’s numbers and check the math every year. Track cost savings, operational costs, and membrane life as real data replaces your estimates. That habit protects your investment and shows the full economic benefits. A well-run water treatment plan brings long-term savings, steady output, and sustainable water treatment for your plant.
FAQ
How long does an industrial reverse osmosis machine last?
With proper maintenance, industrial reverse osmosis systems can last many years. Membrane elements need replacement every 3 to 7 years. The water quality and pretreatment decide the exact timeline. Good maintenance makes the machine last longer and protects your investment.
What payback period should I target?
A payback of 2 to 4 years is strong, but typical payback periods for industrial RO systems range from 3 to 7 years. Paybacks under 3 years are excellent, while those over 7 years require careful analysis. The textile unit example broke even in about 16 months, which shows what strong savings can do.
Which factors change my ROI the most?
Energy savings of 10% to 30% are achievable, according to the US DOE, which can significantly affect ROI. Feed water quality also matters. Poor water shortens membrane life and raises your expenses.
Can I calculate ROI without exact numbers?
Yes. Start with your current water bill and a realistic investment estimate. Use conservative figures for savings and costs. Then revisit the calculation each year as real data replaces your estimates. This habit keeps your projection honest.
What hidden costs should I watch for?
Membrane replacement, unplanned downtime, chemical spikes, and brine disposal fees eat into your returns. A single o-ring failure in a large system can cause tens of thousands in losses. Budget for these items upfront to protect your savings.






 English
 Chinese
 German
 Russian
 Japanese
 French
 Dutch
 Italian